


BUSINESS INTELLIGENCE & DATA WAREHOUSING
Make your business data easier to gather and use
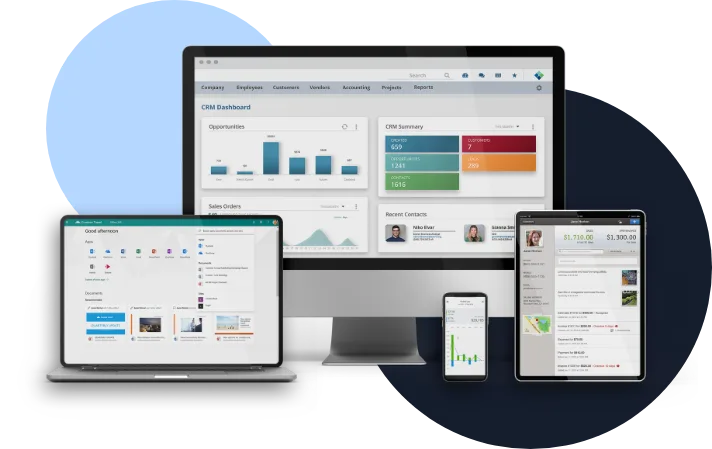
Get easy access to KPIs and business metrics with a visual and interactive dashboard.
Custom dashboards and reports help your team save time by simplifying how users get access to business data.
Data services we provide

Data Strategy
Define a data strategy that will accomplish your business needs.

Architecture
End-to-End solution design from the data sources through user dashboards and reports.

Data Integration
Integrate data from multiple sources into a coherent data warehouse or reporting repository.

Data Warehousing
Consolidate data from multiple systems to see the whole picture.

Analytics
View trends and gain insights through data-driven analytics. Leverage AI-powered predictive analytics for more informed decision-making.

BI Dashboards
Implement customized dashboards to gain visibility and make important decisions.
Common Platforms We Support

Microsoft Azure
Platform
Microsoft’s cloud computing platform that provides infrastructure, platform, and software services for building, deploying, and managing applications.

Microsoft SQL
Database Platform
A relational database management system (RDBMS) developed by Microsoft for storing, retrieving, and managing structured data.
Microsoft Power BI
Tool
A powerful data visualization and business analytics tool that helps users transform data into interactive insights and dashboards.
Build your own custom dashboard
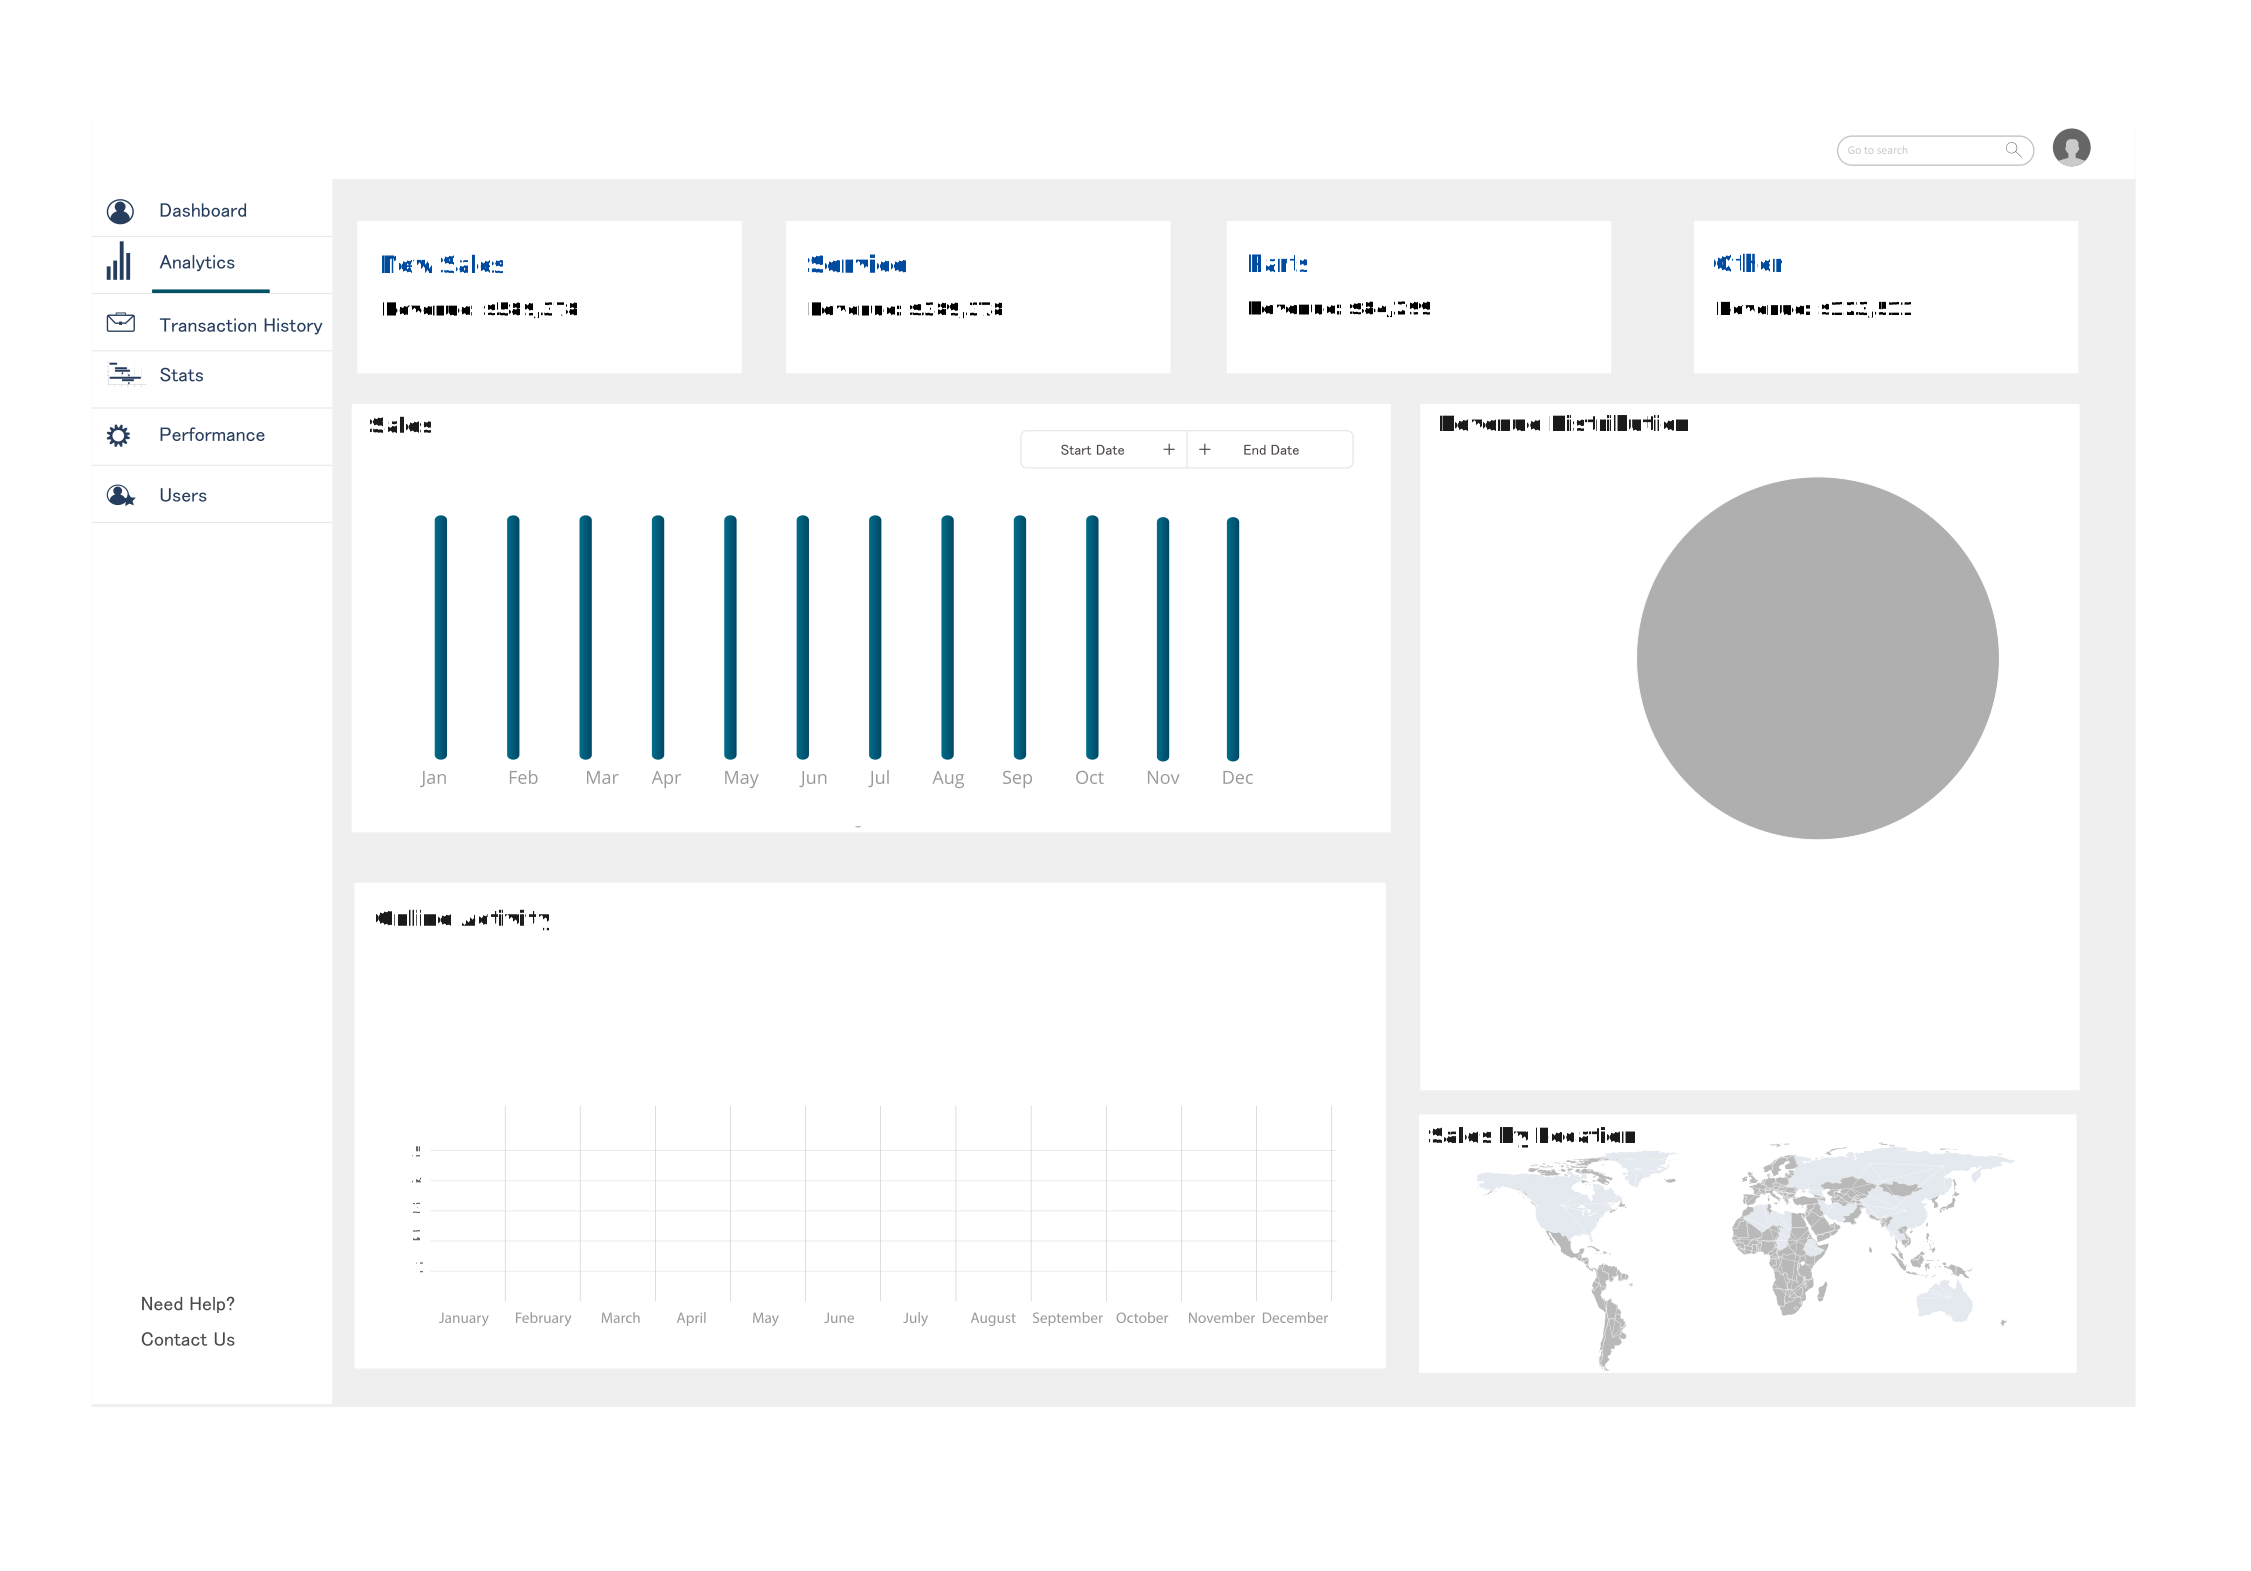
We build fully customized BI dashboards that provide access to the exact information you need, displayed in a way that’s most convenient for you.
Our development process
Here’s how we help you get the most critical, current, and precise information on demand!

Stage I – Vision & Data Strategy
We start with the processes and decisions your reports need to support. Then, we select the right type, format, and information for the reports you need.

Stage II – Data Architecture & Connections
We design the data architecture, map the data connections, and plan for the flow of information for use in your reports.

Stage III – Development
We develop the data repository, load the data, build your reports, and test their accuracy using real-world data. We ensure that your reports are providing the insight you need.

Stage IV – Deploy & Support
Our team gets your reporting solutions in place, aids in adoption by your team, and provides ongoing Support & Evolution services to make sure your reports add even more value over time.
Data Warehouse Services
Are you looking to consolidate the data from all your various systems? Do you wish to enhance your business intelligence and reporting capabilities?
Miles IT has the know-how to take each of your systems and integrate them to ensure you are making sound business decisions for your company as a whole.
We will extract, transform, and load your data from each operational system and structure it into an optimized format for analysis.

Case Study
This custom BI report helps improve decision-making
Before this project, the client did not have an easy way to present their financial information without significant effort. Now, they have connected systems with enhanced functionality, timely access to data, and improved business intelligence.
Common features and capabilities
Get the latest features and capabilities for keeping your data organized.
Filters & Parameters
Select and save filters for ease of use.
Report Sharing
Share reports with other people with a simple click.
Visualization

Get an intuitive view of your data with smartly designed UI and UX.
Widgets

Combine multiple charts and views into a single on-screen display.
Export

Export data into any format. CSV, PDF, Excel, and more.
Scheduled Reports

Schedule reports to run and share automatically.
Notifications
Send notifications triggered by report creation to select users.
Ad-Hoc Reports

Empower staff to access data with permission-based reporting.
Software Reporting Packages
Providing Insights and Business Intelligence
One-Time Service Definitions — Report Components:
See examples of components
One-Time Service Definitions — Report Components:
See examples of components
One-Time Service Definitions — Report Components:
See examples of components

DEDICATED TO YOUR SUCCESS
Work with a team committed to your organization
We’re ready to build a scalable solution so your business can reach its full potential.

In-House Development Team
We provide a complete team under one virtual roof, including Business Analysts, User Experience Experts, Database Architects, Software Consultants, Security Analysts, & HelpDesk.

Business & Technology Knowledge
Our experts leverage their in-depth understanding of software technologies and business processes to help you make the best choices to keep your organization moving forward.

Large Team Support, Small Team Feel
Work with the same people every time while achieving redundancy & scalability with the support of additional team members who understand your unique business and core systems.




HELPING PEOPLE ACCOMPLISH MORE
Our Raving Fans
We are not satisfied if you are just satisfied. We want you to be a Raving Fan as a result of providing the absolute best service!


Lori Martinez
“My company has an account with Miles IT. Whenever we run into an “IT” issue, they are right on it and have very knowledgeable staff to fix all our issues. I love that they are so quick to respond, especially for remote work. Their responsiveness makes all the difference.”
Cheyenne Alvis
“an absolutely Fabulous company to deal with. The analysts are experts at their craft. Fast, concise, professional and extremely reliable. I consider them in high value and recommended regard. Thank you again to the entire team at Miles.”
Anthony Scialabba
“We have worked with Miles IT for years. I have found its employees to be responsive, courteous and generally knowledgeable.”
Let’s build something great together.
Frequently Asked Questions
What is different about the Miles IT approach to reporting that creates such value?
Our proven process, attention to detail, and depth of experience in building reporting solutions and system integrations set us apart in the industry. However, our main reason for success is that we start the process with your business needs and can draw from a wide variety of data reporting platforms and methods to deliver solutions that work best for what YOU need.
Why do I need Management Reports for my business?
Business Management Reports provide important insight into various integral aspects of your business, including sales performance, profitability of clients, and staff productivity.
Can you build reports that incorporate data from multiple different sources?
Yes! We can integrate or synchronize multiple systems’ data into a single report or dashboard to give you insight that no single system’s reporting capabilities can give you. Typical solutions include combining CRM/Sales data with ERP/Operations data to provide a full view of your business flow from start to finish.
What features do I need on my reports?
Our customized approach allows us to create dashboards and reports that are tailored to your needs. Some features you may want to consider include Memorization of Select Filter/Parameters, Sharing Reports with Others, Export (CSV, PDF, Excel), and Scheduled Emailing of Reports.
Can we automate the reporting process?
Yes, our technology is able to learn your preferred settings and can create relevant reports automatically. As part of our focus on process automation, our goal is to save your time by eliminating manual practices that are part of a consistent and repetitive nature.
Why do some business intelligence projects fail?
Old technology, lack of insight/forethought, or a lack of internal support can cause Business Intelligence projects to fail. But the biggest issue is a lack of methodology and consistency for gathering information into a viable and valuable reporting system. It’s impossible to turn out reliable, usable reports when the data is inconsistent, incorrect, or incoherent.